|
ProSticks Articles
Hong Kong Economic Time --- June 27, 2000
Techniques of Modal Point Selection (II)
Previously, we demonstrated that Modal points of long range bars with a large Active Range
are important.
Now, we will continue to discuss the techniques of Modal Point filtering.
Please note that readers should use their own interpretations of the ProSticks concept
and to draw their own conclusions.
Besides a large Active Range, Modal Points of major highs and lows are important.
But how can one identify a major high or low then? A personal rule of thumb is that
when the price rises to a 20-day high and then falls considerably, that high can be
regarded as a major high. Similarly, when the price bounces significantly from a
20-day low, the low can be regarded a major low.
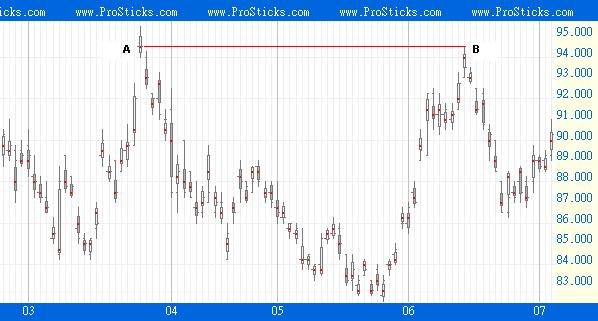
The upper chart below shows the ProSticks chart of HSBC (0005). Notice that bar A
is a major high according to our definition. As can be seen, it posed as a strong
resistance when the price rose to similar levels three months later at B.
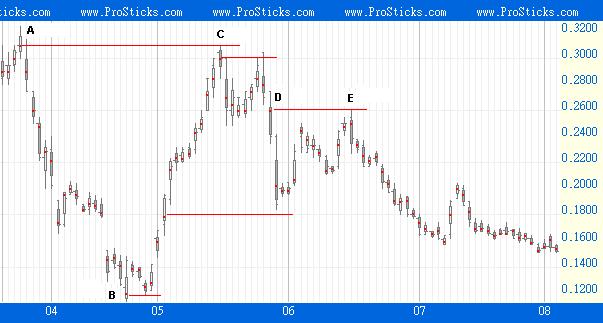
The lower ProSticks chart is of Leading Spirit High-Tech Holdings
(0606). Notice that bar A is a major high and posed as a strong resistance for C.
Consequently, C is also a major high and posed as a strong resistance point for
price movements around D. Bar B, on the other hand, is a major low and
successfully served as a strong support. Please note that D also posed as a resistance
to the price movements at E.
As explained previously, D is a long range bar with its Active Range covering
most of the bar range. Thus, naturally, its Modal Point is of significance.
Please note that the above is not a holy grail. Even if a Modal Point is
important, it does not mean that it is unbreachable. Readers should only use
Modal Points as a benchmark for potentially strong support and resistance levels.
|