Aug 4, 2026  9:04:44 PM HKT

TourSiteMapFAQsAboutContact
Home QR  Forex TV 
UsernamePassword
SavePW
sp

  Home > Education > Articlespatentsp
  
sp
sp
sp
articles
 

Prosticks Articles

Hong Kong Economic Journal --- Nov 27, 2000

Modal Point RSI Alert

Traditional technical indicators such as RSI, Stochastics and Moving Average are calculated using closing prices. As we have said many times before, closing prices may not be the most representative price of the daily market activities. They are subject to manipulation, market over-reaction, or even wrong input by the particular software you are using. To summarize the overall market activities throughout the day, the Modal Point is a better choice, because it is the price which is backed by volume.

Thus, we can use the Modal Points to recalculate all the traditional technical indicators. The results may be enlightening.

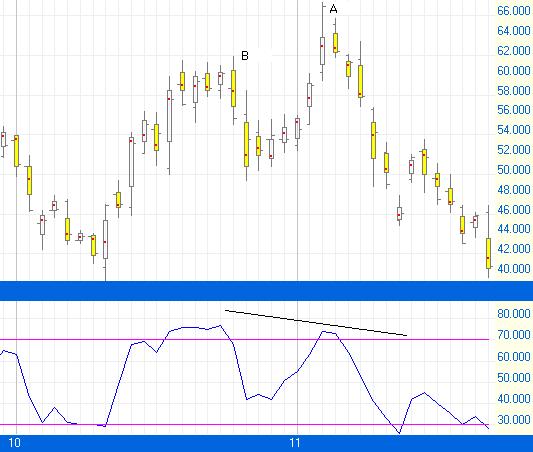
Figure 1 shows the Prosticks chart of the PALM pilot. Everybody knows that PALM is the most favorite handheld computer around the world. Accompanied the chart the RSI plot is shown. However, the RSI is calculated using Modal Points instead of the traditional closing prices.

As can be seen, at A, price made a new high compared to B. However, the RSI plot at A failed to make a new high. This is a divergence situation. According to the theory, when divergence occurs, the market is topping. As can be seen, price subsequently underwent a severe correction.

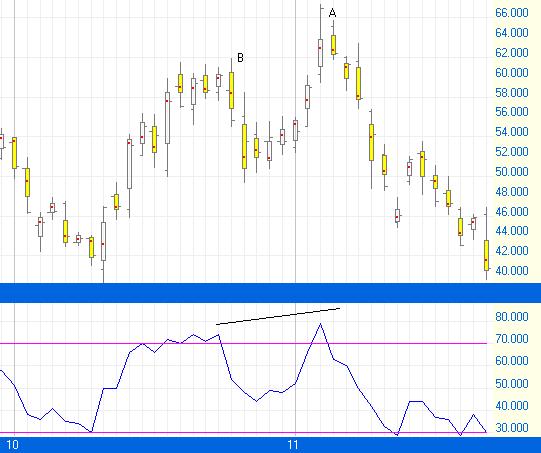
Figure 2 shows the same chart of PALM. However, this time, the RSI is calculated using the traditional closing prices. As can be seen the divergence situation at A is absent. Thus, while the RSI using Modal Points suggests that the market is topping at A, traditional RSI using closing prices fail to signal it.

In the Prosticks official website, users can choose to calculate various indicators using either the closing prices or the Modal Points. Users are encouraged to explore themselves the difference of the indicators calculated by both approaches.

One more thing about the PALM chart. Notice that bar A is a very long bar with the closing price near the day high. Thus bar A is a very bullish bar according to Candlestick theory. However, the Prosticks bar of A is not very bullish. The Active Range is concentrated in the bottom part of the day range, meaning that though price closed strong, the rally is not accompanied by volume. The rally is suspicious.


sp
agreementspprivacysppatent
sp
sp
sp
sp

Copyright© 2026 ProSticks.com Limited. All rights reserved. ProSticks.com Limited, Hong Kong Exchanges and Clearing, HSI Services Limited, endeavor to ensure the accuracy and reliability of the information provided but do not guarantee its accuracy or reliability and accept no liability (whether in tort of contract or otherwise) for any loss or damage arising from any inaccuracies or omission. Currently, all Hong Kong stock and index quotes are at least 15 minutes delayed. Currency and commodity quotes are all 10 minutes delayed. All others are updated irregularly.