|
Prosticks Articles
Hong Kong Economic Journal --- 16 Oct, 2000
Fibonacci Numbers and Modal Points
No markets are able to keep rising or falling
vertically without any setbacks. Even a powerful uptrend
will undergo a correction every now and then. By the same
token, even the most gloomy downtrend will experience
periodic sudden and abrupt rebound, catching the bears by
surprise.
The strategy is to predict when the correction or
rebound phase will end. Theoretically, after the
correction or rebound is over, the previous up or down
trend will resume at least for a while.
One way to predict price targets for corrections are
called Fibonacci levels. The theory goes that during a
correction, the market will retrace either 38.2%, 50%, or
61.8% of the distance between the high and low point of
the trend. This is considered to be an unaccountable
phenomena in the stock/currency market and that is why the
three Fibonacci ratios are termed magic numbers?
Fibonacci levels are astonishingly accurate and
reliable. Frequently, market tops and bottoms occur at
price levels in consistent with one of the Fibonacci level
of a previous high and low pair. Mysterically, usually
those levels coincide with some important Modal Platform
too.
As explained many times before, individual prices such
as high and low represent only two trading instances. They
are thus subject to manipulation, market overreaction, or
even wrong data entry. Thus, using them to compute
Fibonacci levels at times are inaccurate and unreliable.
Figure 1 shows the Candlestick chart of the British
Pound. As can be seen, from A to B, the
currency undergoes a more than 800 point uptrend.
Correction then occurred which pushed price from B
to C and then the market rose again. Notice that if
we use the low point of A and the high point of B
to apply the Fibonacci levels, we can explain why C
occurred at the price level as it was.
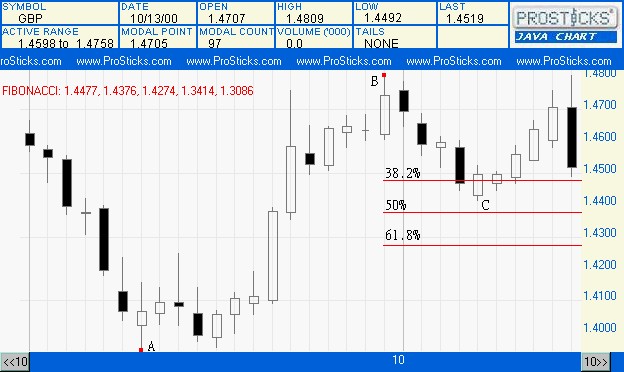
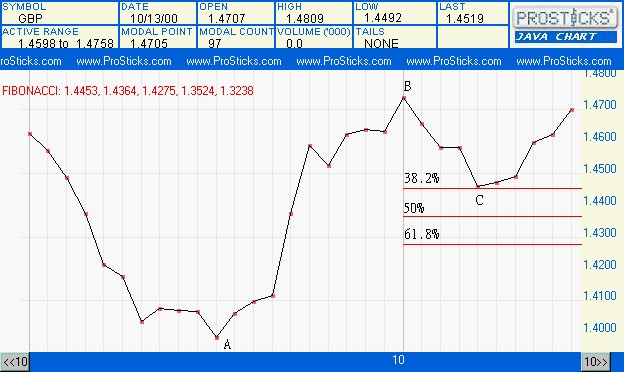
Figure 2 shows the Modal line chart of the British
Pound. As can be seen, if we use the Modal Point of A
and B to compute the Fibonacci levels instead, we
will find out that the Modal Point of C lies
exactly right on the 38.2% level, a manifestation of the
magic of the Fibonacci number.
|