|
Prosticks Articles
Hong Kong Economic Journal --- 9 Oct, 2000
The Use of Spikes
Most currencies underwent volatile sessions last week,
after the Euro intervention. Where should they be heading
this week? Let us consult the Prosticks charts.
Figure 1 shows the Prosticks chart of the Euro dollar.
Last week we had talked about how the Modal Count
indicator could enable us to anticipate the intervention
day (marked A in the figure).
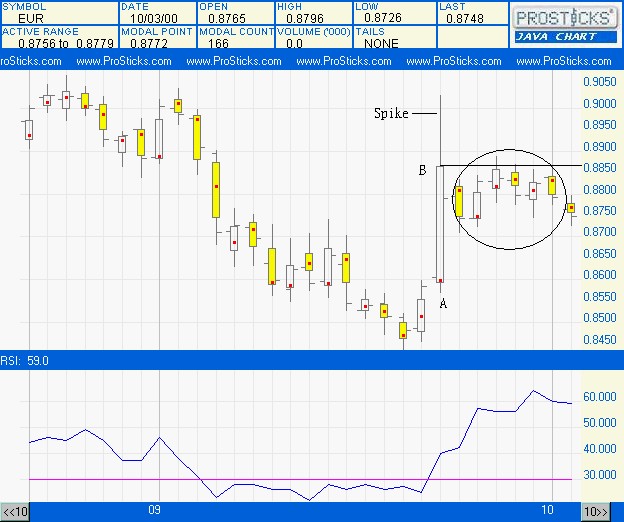
Notice that the intervention day, though being a
remarkable rally, does not end up closing strong. The
Active Range does not cover the upper part of the bar
range. What does this indicate? This indicates that when
price rose to high levels, it was rejected quickly by
selling forces, and was never able to trade back at those
high levels. Resistance at high prices were thus
significant. We call these price ranges at high or low
prices outside the Active Range Spikes? When a bar has a
long spike at high prices, it means that strong resistance
exists there. Conversely, when it has a long spike at low
prices, it signifies strong support there.
After the intervention day, the rally lost steam.
Notice the circled bars after the intervention day, all of
them are contained inside the Active Range of the
intervention bar (marked B) . Occasionally their
spikes traded outside B, but their Active Ranges
never penetrated above B. Furthermore, the RSI is
falling. All these indicate that selling pressure in the
Euro is still very severe, particularly above the 0.89
level. The downtrend may not be over despite the
intervention. Not until the Active Range of a bar is able
to penetrate above B, one should be hesitant to
long the currency.
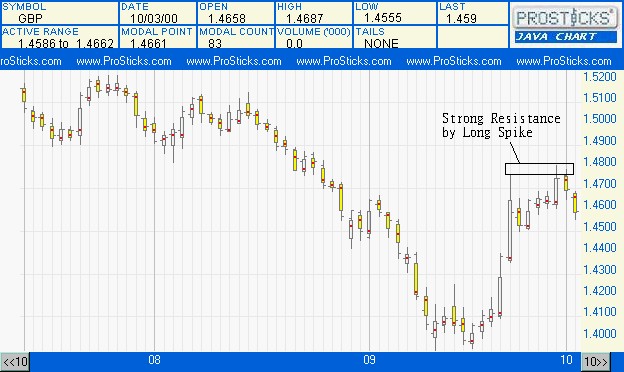
Figure 2 shows the Prosticks chart of the British
Pound. As can be seen, after the powerful rebound, long
spikes emerge, indicating that at price levels above 1.47,
strong resistance exists. The bulls should be cautious.
|