Jun 15, 2026 5:14:50 AM HKT
ADX指標測出走勢強弱
很多人用
在這方面,
香港的投資者不是很習慣用
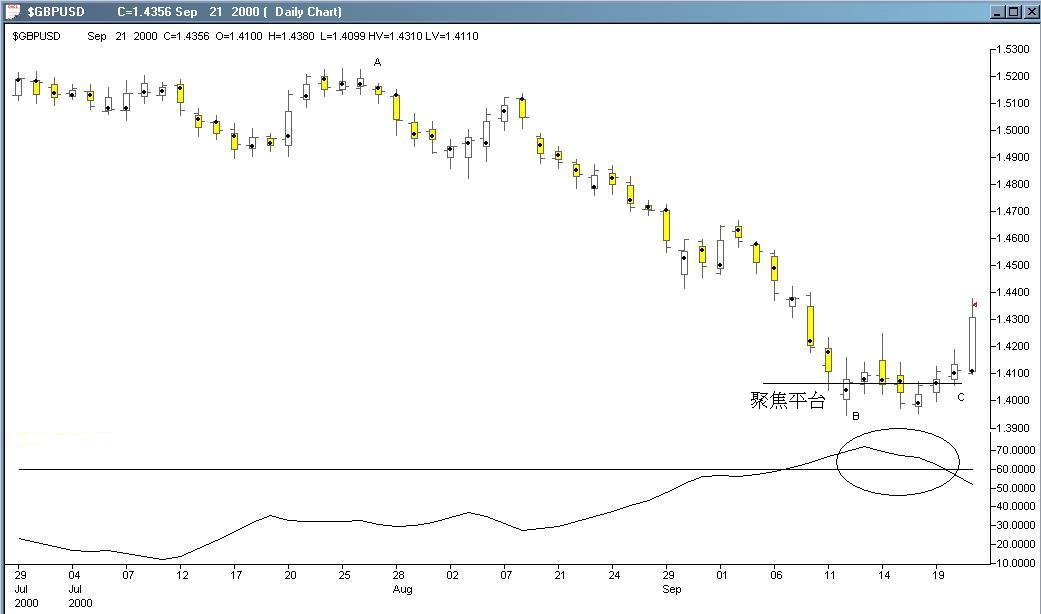
英鎊兌美元的乾坤燭及
如果讀者看
在乾坤燭網站中,有股票及外匯的
(有關乾坤燭連載可在乾坤燭網站
英鎊兌美元乾坤燭圖
(2000年6月29日 - 9月21日)