ProSticks is not limited to only chart patterns and formations. Traditional indicator analysis can also benefit by concurrently studying ProSticks' time and volume elements. ProSticks can both serve as confirmation of indicator signals and warn against potential false signals. 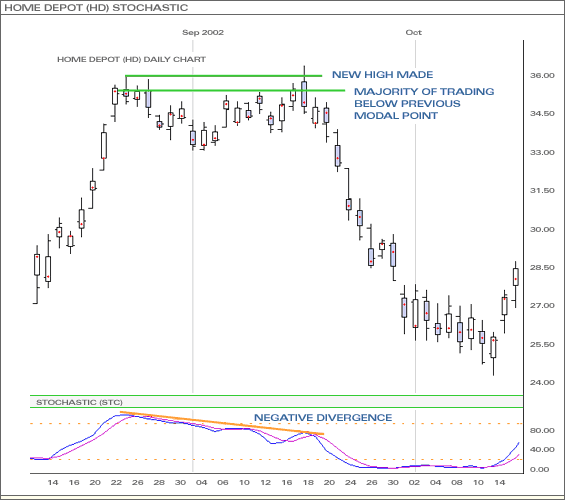
In the above example, the price was trading near the highs when a negative divergence occurred with the Stochastic indicator. This is a very powerful signal and considered very bearish. ProSticks also confirmed the bearish note. When the new high was made, the majority of trading happened below the previous Modal Point high. The price closed well below the Modal Point resistance on the day that the new high was made. This further showed a lack of buying power and thus, all technical studies pointed to a top in the price of the security. 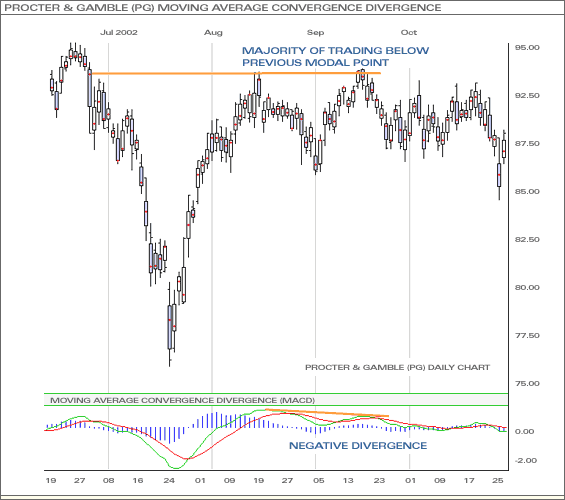
The above example also illustrates the advantages of using ProSticks' time and volume analysis with traditional technical tools such as the Moving Average Convergence Divergence (MACD) indicator. After the strong rally, the price met strong resistance at a previous Modal Point. On the second time around, the resistance remained strong as a majority of the trading was below the resistance. As the price retraced again, negative divergence had formed on the MACD. This helped confirm the weakness of the buyers and soon afterwards, the price went on a decline. 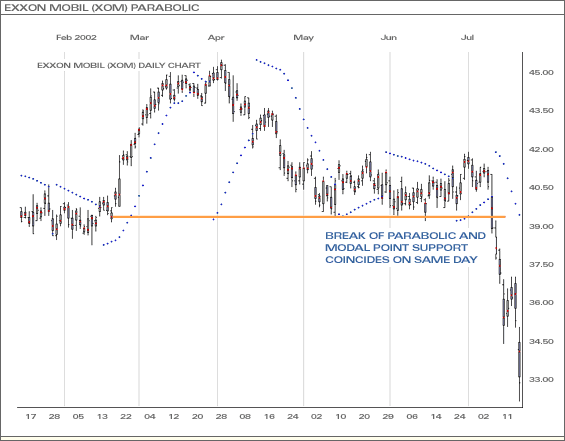
The above example shows a bearish Parabolic Stop-and-Reversal (SAR) signal coinciding with the break of a strong Modal Point support. As the price topped and began its descent, the first strong support it met was at a Modal Point made at the beginning of the prior rally. The price then consolidated above this support for about two months before a strong sell-off sent it spiralling down. The previous breaks of the SAR were not as strong as the final break because it coincided with the break of the Modal Point support. Thus, one can see how ProSticks can help confirm traditional indicator signals. |